Ultimate Guide to Marketing KPIs for Small Businesses
Are your marketing efforts paying off? For small businesses, tracking the right marketing KPIs (Key Performance Indicators) is the difference between wasting money and fueling growth. KPIs are specific metrics that measure whether your marketing is driving results like sales, customer retention, or cost efficiency.
Here’s what you’ll learn:
- Why KPIs matter: They turn data into actionable insights, helping you make smarter decisions.
- How to choose the right KPIs: Focus on goals like revenue, customer acquisition, or retention.
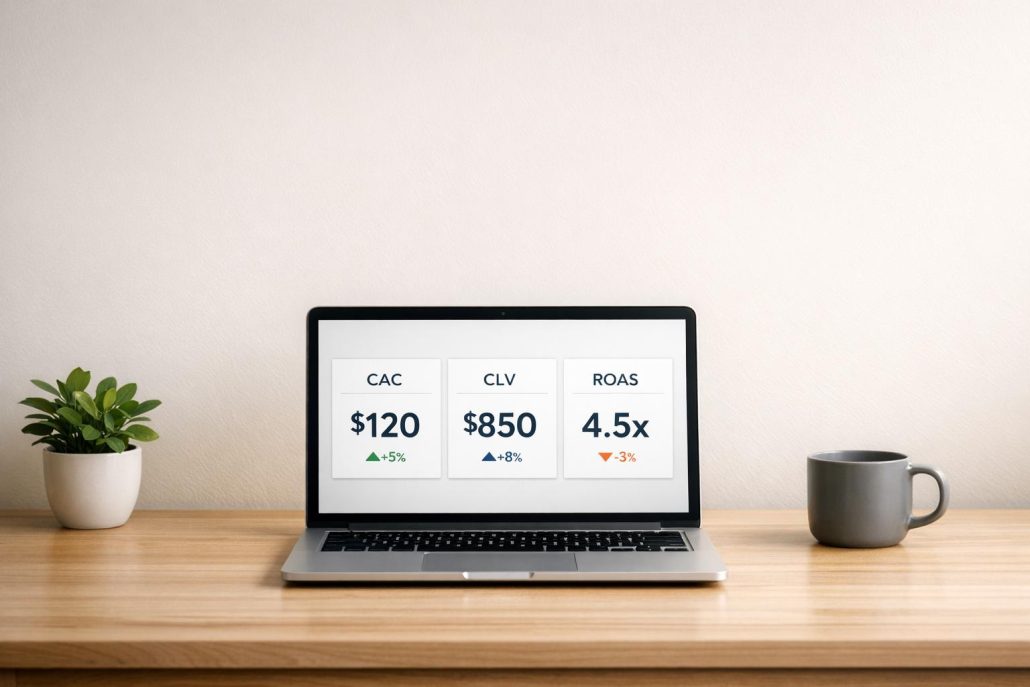
- Key KPIs to track: CAC (Customer Acquisition Cost), CLV (Customer Lifetime Value), Conversion Rate, ROAS (Return on Ad Spend), and Marketing ROI.
- Tools to track them: Use dashboards like HubSpot or Databox to monitor performance in real-time.
- How to improve: Regularly review metrics, identify issues, and take focused actions.
Bottom line: Monitor 3–5 KPIs that align with your business goals. Skip vanity metrics like social media likes and focus on numbers that impact profitability. Ready to make data-driven decisions? Let’s dive in.
What Marketing KPIs Are and Why They Matter
What Are Marketing KPIs?
Marketing KPIs, or Key Performance Indicators, are measurable values that help track how well your marketing efforts align with and achieve specific goals like increasing revenue or retaining customers. These indicators answer big questions like: Are our campaigns driving sales? Are we acquiring customers efficiently? Which marketing channels deserve more investment?
As G2 explains:
"All KPIs are metrics, but not all metrics are KPIs – and some metrics are just vanity in disguise".
Here’s the difference: metrics show raw data and operational trends – they tell you what happened. KPIs, on the other hand, focus on progress toward critical business outcomes – they tell you why it matters. For instance, tracking website sessions is a metric; it shows activity. But tracking the conversion rate is a KPI because it tells you how well that traffic is turning into actual customers.
Metrics like social media likes, follower counts, or page views may look great on paper, but they often don’t qualify as KPIs since they don’t directly influence key business decisions or revenue. KPIs, however, guide major decisions about budgets, strategies, and executive priorities. Metrics, meanwhile, are more useful for monitoring daily operations and making tactical adjustments.
| Feature | Marketing Metric | Marketing KPI |
|---|---|---|
| Primary Purpose | Tracks the status of specific processes | Measures progress toward critical goals |
| Decision Level | Supports tactical/operational decisions | Influences strategic/executive decisions |
| Focus | Shows what happened | Shows why it matters for business health |
| Examples | Page views, email open rates, social likes | CAC, CLV, Marketing ROI, Conversion Rate |
Understanding this distinction is crucial, especially for small businesses looking to maximize their efforts.
Why Small Businesses Need KPIs
For small businesses, KPIs are more than just numbers – they bring clarity and accountability to marketing efforts. They help answer the critical question: Is our marketing spend delivering results? With limited resources, small businesses can’t afford to rely on guesswork. KPIs ensure that every dollar and hour spent on marketing is contributing to growth.
Consider this: only 3% of CMOs can confidently attribute more than half of their marketing budget to measurable results. That means most businesses are making decisions without solid data to back them up.
KPIs change the game. By focusing on measurable outcomes, businesses can adjust strategies based on what’s actually working, ensuring resources are allocated to high-performing channels. They also help teams stay aligned with larger company goals, avoiding wasted effort on activities that don’t drive meaningful progress. As Ben Kazinik from monday.com puts it:
"Marketing KPIs in 2026 are no longer about reporting activity. They’re about proving impact".
Without KPIs, businesses risk spinning their wheels without improving. With KPIs, you gain a clear view of your business’s health and growth potential – allowing you to assess whether your current strategies are sustainable.
sbb-itb-0a5855c
How to Select the Right KPIs for Your Business
Matching KPIs to Your Business Goals
Picking the right KPIs starts with understanding what your business is trying to achieve. Define your core objectives – whether it’s increasing revenue, lowering customer churn, or entering new markets. Without clear goals, you might end up tracking data that looks good on paper but doesn’t drive real progress.
Turn these objectives into key questions that your KPIs should answer. For example, if your goal is revenue growth, ask: "Are we increasing revenue per customer over time?". This approach helps you focus on metrics that truly matter.
From there, choose KPIs that directly address these questions. Make sure they follow the SMART framework: Specific, Measurable, Attainable, Relevant, and Time-bound. Avoid vague targets; instead, aim for actionable goals like cutting Customer Acquisition Cost by 15% within six months.
Test each KPI by asking if it impacts your overall strategy, interests leadership, and can be measured reliably. If the answer to any of these is no, it’s likely just a metric – not a true KPI. As G2 explains:
"If a number changes and you act on it, it’s probably a KPI".
Stick to 3–5 key KPIs for each department or campaign to avoid data overload and maintain focus. Also, align your KPIs with your business model. For B2B companies, relationship-building metrics like Marketing Qualified Leads (MQLs) and pipeline velocity are crucial. For B2C businesses, transaction-focused metrics like Average Order Value and cart abandonment rates take priority.
| Business Model | Primary KPI Focus | Key Metrics |
|---|---|---|
| B2B | Relationship & Pipeline | MQL-to-SQL Conversion, Pipeline Velocity, Account Engagement |
| B2C | Transaction & Volume | Average Order Value (AOV), Cart Abandonment, Repeat Purchase Rate |
For expert guidance on aligning KPIs with your goals, Green Forest Marketing provides tailored solutions.
Once you’ve identified KPIs tied to your business objectives, the next step is figuring out which metrics reflect performance across each stage of the customer journey.
Choosing KPIs for Each Stage of the Customer Journey
After aligning your KPIs with your goals, map them to the customer journey to better understand where customers succeed or drop off. Each stage of the journey requires different metrics.
At the Awareness stage, focus on reach. Track metrics like impressions, website traffic, and social reach. A newer metric, AI Visibility, is becoming increasingly important. By 2026, AI Visibility – how often your brand appears in AI-generated answers – has gained traction, as over 20% of Americans regularly use AI tools.
For the Consideration stage, measure engagement. Metrics like Click-Through Rate (CTR), time on page, and email open rates can reveal where potential customers lose interest. As Harvard’s Sunil Gupta points out:
"It isn’t enough to measure the final outcome alone. You also need to track intermediate metrics to understand where consumers might be getting stuck – essentially bottlenecks in the marketing funnel".
At the Conversion stage, focus on results. Track KPIs like Conversion Rate, Cost Per Acquisition (CPA), and Return on Ad Spend (ROAS) to measure how effectively you’re turning leads into customers.
Finally, during the Retention stage, measure loyalty and long-term value. Metrics like Churn Rate, Customer Lifetime Value (CLV), and Net Promoter Score (NPS) help ensure you’re not just gaining customers but keeping them.
| Journey Stage | Focus Area | Recommended KPIs |
|---|---|---|
| Awareness | Brand recall & reach | Impressions, AI Visibility, Brand Mentions, Social Reach |
| Consideration | Engagement & intent | Website Traffic, Time on Page, Email Open Rate, CTR |
| Conversion | Sales & efficiency | Conversion Rate, Cost Per Acquisition (CPA), ROAS, MQLs |
| Retention | Satisfaction & value | Churn Rate, Customer Lifetime Value (CLV), NPS, Retention Rate |
Marketing KPIs Small Brands Must Track
The Most Important Marketing KPIs for Small Businesses
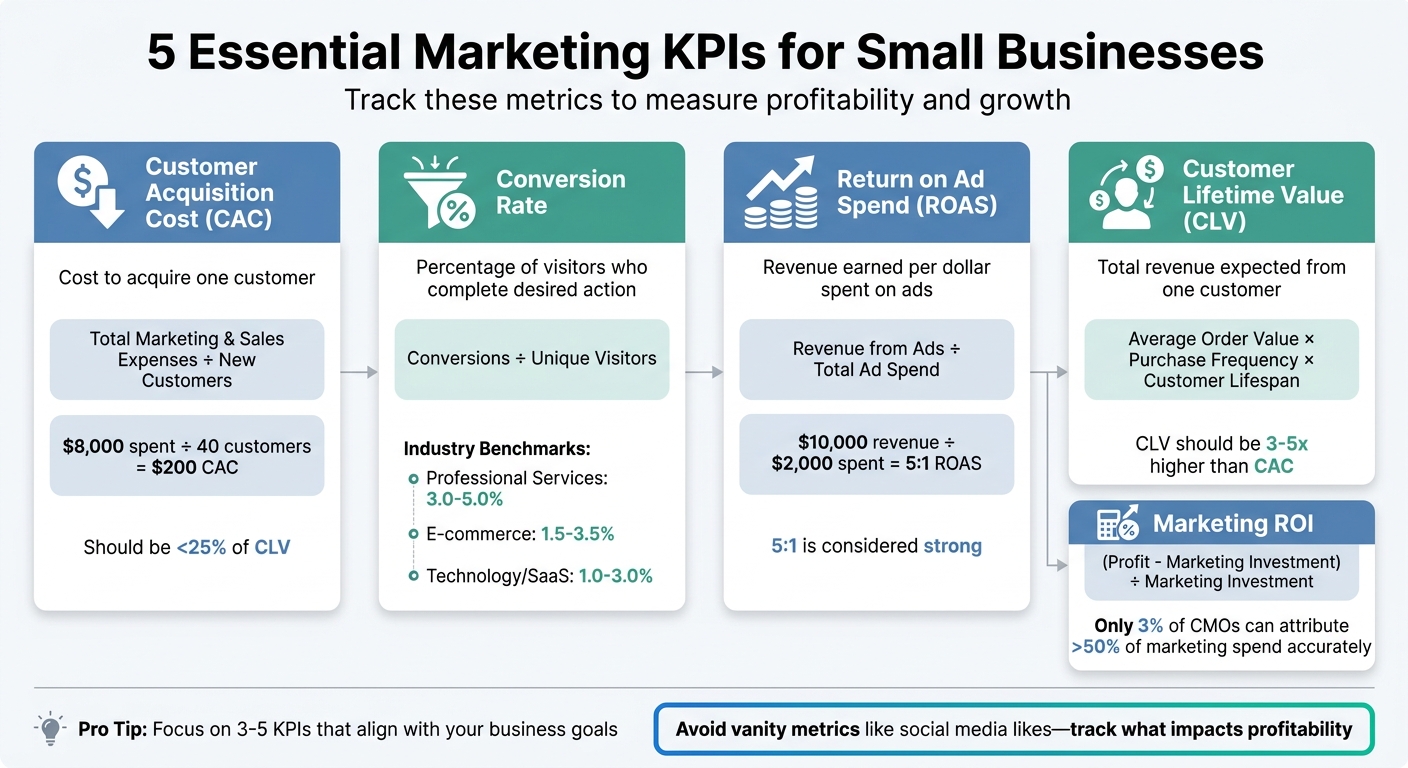
5 Essential Marketing KPIs Every Small Business Should Track
To ensure your marketing efforts fuel profitability, aligning your KPIs with your goals and customer journey is critical. Here are five key metrics every small business should monitor.
Customer Acquisition Cost (CAC)
Customer Acquisition Cost (CAC) measures how much you spend to acquire a single customer. To calculate it, divide your total marketing and sales expenses – this includes ads, salaries, and overhead – by the number of new customers you gain.
For example, if you spend $5,000 on ads and $3,000 on marketing salaries in a month, and acquire 40 new customers, your CAC is $200. This is a more accurate figure than $125, which you’d get if you only considered ad spend.
CAC becomes especially meaningful when paired with Customer Lifetime Value (CLV). Ideally, your CAC should be less than 25% of your CLV. As G2 aptly puts it:
"In a world where every dollar is under scrutiny, tracking marketing KPIs isn’t optional; it’s the only way to show measurable business results."
Without comparing CAC and CLV, it’s impossible to know if your acquisition strategy is sustainable or if you’re overspending on customers with limited long-term value.
While CAC focuses on costs, conversion metrics show how effectively you’re turning interest into revenue.
Conversion Rate
Your conversion rate tracks the percentage of visitors completing a desired action, like making a purchase or signing up for a trial. To calculate it, divide the number of conversions by the number of unique visitors.
Industry averages vary by sector:
- Professional services: 3.0% to 5.0%
- E-commerce: 1.5% to 3.5%
- Technology/SaaS: 1.0% to 3.0%
Monitoring conversion rates at each stage of your funnel helps pinpoint where potential customers drop off. For instance, high traffic with low conversions might signal mismatched messaging or friction in the user experience. Often, improving your conversion rate is more cost-effective than driving additional traffic.
Once you’ve optimized acquisition and conversions, it’s time to assess how efficiently your ad spend translates into revenue.
Return on Ad Spend (ROAS)
Return on Ad Spend (ROAS) measures the revenue earned for every dollar spent on advertising. To calculate it, divide the revenue generated by ads by the total ad spend.
For instance, spending $2,000 on Facebook ads that generate $10,000 in revenue results in a 5:1 ROAS. A ratio of 5:1 is generally considered strong across most industries.
ROAS helps you evaluate the performance of individual campaigns and platforms, guiding you to allocate your budget to the most profitable channels. Platforms like Google and Meta offer AI-driven bidding tools to optimize for a target ROAS, though these tools typically require 30 to 50 conversions per month to work effectively.
For a more comprehensive view of profitability, pair ROAS with CAC and Marketing ROI.
Customer Lifetime Value (CLV)
Customer Lifetime Value (CLV) estimates the total revenue you can expect from a single customer over their relationship with your business. Multiply the average order value by purchase frequency and average customer lifespan to calculate it.
CLV shifts the focus from one-time transactions to recurring revenue, helping you decide how much you can afford to spend on customer acquisition. For e-commerce, a CLV at least three times higher than CAC is a good benchmark. In B2B and SaaS, a 3:1 to 5:1 ratio signals sustainable profitability.
Tracking CLV by customer segment and monitoring short-term trends – like one-month or annual CLV – can provide early insights into repurchase behavior and overall customer value.
Marketing ROI
Marketing ROI evaluates the profitability of your marketing investments. Use this formula: (Profit – Marketing Investment) / Marketing Investment.
This metric answers the key question: Is your marketing spend generating a worthwhile return? As ProfileTree explains:
"The board doesn’t care about the dashboard. They care about one number – how much did we spend, and how much did we get back?"
Only 3% of CMOs can attribute more than half of their marketing spend accurately. Multi-touch attribution models, which distribute credit across all customer touchpoints, offer a clearer picture of ROI.
Marketing ROI helps justify budgets, identify underperforming channels, and focus resources on strategies that deliver the best returns .
| KPI Type | Primary Purpose | Key Consideration |
|---|---|---|
| Strategic (KPI) | Guides budget and strategy | CAC, CLV, Marketing ROI |
| Operational (Metric) | Supports tactical adjustments | Website sessions, CTR, Time on page |
| Vanity Metric | Limited actionable insight | Social followers, Pageviews, Likes |
Concentrate on strategic KPIs like CAC, CLV, and ROI to make informed decisions about budget allocation and resources. While operational metrics are helpful for day-to-day tweaks, they shouldn’t dictate major business strategies.
How to Track and Improve Your KPIs
Tools and Dashboards for KPI Tracking
Choose a dashboard tool that aligns with your team’s expertise and the software you already use. For example, HubSpot is a solid choice if you’re already using their CRM. It seamlessly integrates data from campaigns, landing pages, and emails, offering drag-and-drop customization. If you’re part of a smaller team that values flexibility, Databox might be a better fit. It connects with over 75 platforms like Google Analytics, Shopify, and Stripe, and includes 200+ pre-built templates along with a mobile app for real-time updates.
Before diving into dashboard creation, think about who will use it. Executives often need high-level summaries that highlight revenue impact, while marketing managers benefit from more detailed, channel-specific data for tactical decisions. Keep your dashboard focused by limiting it to five to nine key metrics – too much data can overwhelm and reduce its effectiveness. As Hannah Harris from HubSpot explains:
"The simpler it is, the more useful it becomes. A good dashboard doesn’t try to track everything under the sun – just the stuff that really matters".
To set up your dashboard, start by connecting your data sources, defining baselines for each KPI, and setting achievable targets. Sketch out the layout to emphasize the most critical metrics before configuring the software. Include a mix of leading indicators (e.g., website traffic, email open rates) to anticipate trends and lagging indicators (e.g., revenue, churn) to measure outcomes.
With a well-designed dashboard, you’ll be able to pinpoint issues quickly and take action effectively.
Ways to Improve Your KPI Results
Once your dashboard is live, use it as a tool to drive meaningful improvements. Regularly assess and prioritize actions on your KPIs. One effective method is the Traffic Light System, which categorizes metrics as Green (on track), Yellow (needs attention), or Red (requires immediate action). Before making changes, ensure you know who owns the metric, whether it’s actionable, and what the plan is if it shifts.
For example, if your Customer Acquisition Cost (CAC) increases, consider reallocating your budget to lower-cost channels and refining your audience targeting. If you’re seeing low conversion rates, test simplified CTAs or examine the sales process for potential bottlenecks. When churn rises, exit surveys and usage data can help uncover issues like poor onboarding or a lack of perceived value. Addressing these systematically can make a significant difference. Keep in mind that improving customer retention by just 5% can increase profits by 25% to 95%, often making retention efforts more impactful than focusing solely on new customer acquisition.
Review a focused set of 3–5 key KPIs per department on a quarterly basis to ensure they stay aligned with shifting objectives. As Huey Yee from MarketersMEDIA puts it:
"The edge won’t come from tracking more. It will come from tracking the right metrics with precision and acting on them with speed".
How to Visualize KPI Data
Once you’ve set up your KPI tracking, the next step is visualization – turning raw numbers into insights you can act on. Joe Domaleski, with over 25 years of marketing experience at Country Fried Creative, sums it up perfectly:
"I’ve been a professional marketer for over 25 years. Dashboards are, without a doubt, the most effective way to track marketing".
Dashboards bring together data from tools like Google Analytics, social media platforms, email campaigns, and ad accounts into a single, easy-to-read interface. This consolidated view helps you see what’s happening across your marketing efforts in real time.
Dashboards vs. Reports: Why Real-Time Matters
Dashboards provide real-time monitoring, which is crucial for making quick adjustments. Reports, on the other hand, offer static, historical snapshots that are more suited for accountability and long-term analysis. For small businesses, dashboards can be game-changers. Imagine catching a sudden spike in your cost-per-click on a Friday afternoon – without a dashboard, you might not notice until a monthly report arrives two weeks later. The ability to act quickly ties directly to improving your KPIs.
Designing Effective Visualizations
When creating dashboards, focus on the metrics that matter most. Too much information can overwhelm and dilute the insights. Choose the right visualization style for your data:
- Trend lines to show changes over time
- Bar charts for side-by-side comparisons
- Pie charts to highlight proportions or distributions
For example, in February 2025, Country Fried Creative used a dashboard to compare Facebook performance from December 2024 (organic posts) to February 2025 (with ads). The results? Impressions skyrocketed from 948 to 232,798, and engaged users grew from 114 to 386. However, the engagement rate dropped to 0.17% due to the massive reach expansion. Without this visualization, such nuanced insights could have been buried in spreadsheets.
Practical Tips for Dashboard Setup
Before you start, ensure you have admin-level permissions for all platforms you plan to connect. Keep in mind that not all tools update at the same pace – some refresh hourly, others daily. This difference can impact how you interpret data during reviews.
For smaller teams, tools like DashThis or Databox are great for quick setup and ease of use. If you’re looking for more customization and have the resources to learn, Google Looker Studio and Tableau are solid options. Ben Kazinik from monday.com also emphasizes the importance of tailoring dashboards to your audience:
"Dashboards only create value when they track the right metrics. High-performing teams design tiered views so each audience sees information relevant to their role".
Finding the Right Balance
About 48% of marketing professionals check their dashboards weekly or bi-weekly. This frequency strikes a balance – frequent enough to spot trends but not so often that you overreact to daily fluctuations. The key is to track what truly matters and make it visible so you can act on it quickly. When integrated into your broader KPI strategy, dashboards turn data into decisions, helping you refine and optimize your marketing efforts continuously.
Conclusion
Marketing KPIs are more than just numbers – they’re the key to understanding whether your marketing efforts are actually paying off. Yet, only 23% of marketers feel confident they’re tracking the right KPIs. That means many small businesses are navigating their campaigns without a clear sense of whether they’re driving revenue or managing costs effectively. It’s time to change that by tracking the metrics that matter.
The focus should always be on value over vanity. Sure, metrics like social media followers or page views might look great on paper, but they don’t tell you if your marketing dollars are actually working for you. Instead, metrics like Customer Acquisition Cost (CAC), Return on Ad Spend (ROAS), and Customer Lifetime Value (CLV) answer the real questions: Are we profitable? Can we sustain this? As Jonathan Aufray, CEO of Growth Hackers, wisely asks:
"…do your marketing KPIs help you move the needle?"
To get started, keep it simple. Choose three to five KPIs that align directly with your business goals. For example, if your goal is revenue growth, focus on CAC and ROAS. If customer retention is your priority, CLV should be front and center. Set SMART (Specific, Measurable, Achievable, Relevant, Time-bound) goals so you have a clear definition of success. Use a dashboard to track these metrics weekly for day-to-day adjustments, and report on them monthly or quarterly to keep leadership informed of the bigger picture.
FAQs
What’s the quickest way to choose my 3–5 most important marketing KPIs?
To pick your top 3–5 marketing KPIs quickly, zero in on metrics that tie directly to your main business objectives – whether that’s boosting sales, generating leads, or growing brand awareness. Look for measurable indicators like revenue growth, lead conversion rates, or website traffic that clearly reflect progress. This approach helps you focus on meaningful data and steer clear of distractions from less relevant metrics.
How do I know if my CAC and CLV are healthy for my business?
To gauge whether your Customer Acquisition Cost (CAC) and Customer Lifetime Value (CLV) are in good shape, start by comparing them to industry standards. A common target for many small businesses is keeping CAC at roughly one-third (or less) of CLV.
Monitoring these metrics over time is crucial. For example, if you notice your CAC creeping up or your CLV dropping, it could signal inefficiencies in your marketing strategies. By keeping an eye on these trends, you can make adjustments to ensure your efforts remain profitable.
How often should I review KPIs without overreacting to daily changes?
Review your KPIs weekly or monthly to keep a clear view of your progress without getting caught up in daily changes. The right frequency depends on your business objectives and the type of KPIs you’re tracking. Consistent reviews allow you to focus on long-term patterns instead of being distracted by short-term shifts.
